
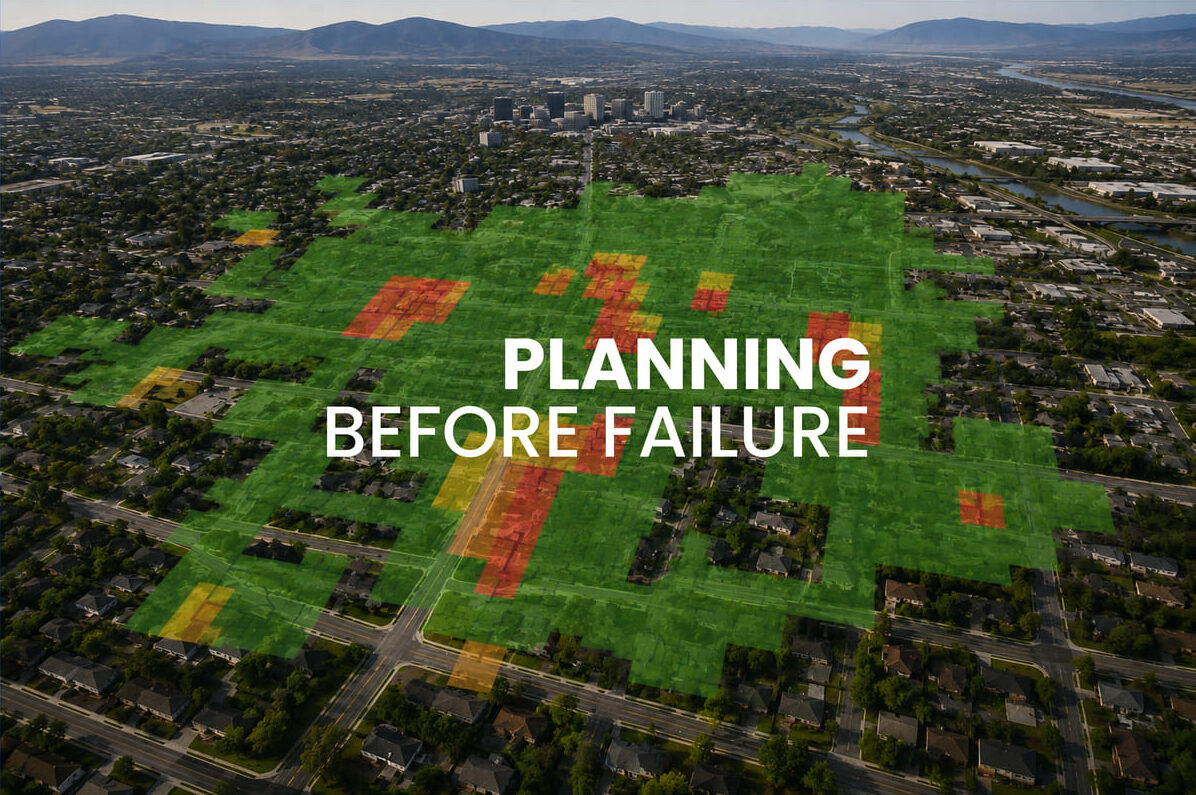
There is no shortage of data; however, when we take a closer look, we find that most utilities are using the same single-variable age model that has been used for decades. The issue is that this method, while trusted, does not leverage the data, tools, and advanced technology available today. When we use data to properly assess risk, plans become more credible, risk-informed, and influential. Here’s how to use better risk data to justify pipe replacement budgets to councils and boards.
Asking the right question “Why risk-based capital planning” beats “Replace the pipes that broke last.”
The wrong question is “Should we wait to see which pipes fail next, or spend on pipes that broke last?” The winning question is “Which pipes are most at risk and have the greatest consequences?” If we wait for a crisis and respond reactively, the cost is likely to be three to five times higher. Deferred replacement is not savings – it is the most expensive form of financing available: borrowing against emergency budgets, eroding customer trust, and losing political capital, at compounding interest. The core logic of risk-based capital planning is proactive replacement using science, rather than reactive replacement, one emergency at a time. Lead with that reframe before any numbers.
Risk-based planning is about finding the sweet spot between taking and mitigating risk. What level of Risk is a Utility Comfortable with? There are always more potential projects than there is funding, so the question is, “Where do I feel comfortable taking risk?” This is where CoF comes in. Prioritize your projects based on BRE.
Make the invisible visible: Prioritizing pipe replacement by risk
Councils approve what their constituents can see. Build the case around a few simple visuals that support asset prioritization:
- A GIS map of the distribution system.
- The replacement-rate math: if you replace at 0.5% per year, you’ve implicitly assumed a 200-year asset life – for pipes with documented service lives of 75–125 years (AWWA, Buried No Longer: Confronting America’s Water Infrastructure Challenge, 2012). That single ratio is the most damning statistic in the industry, and most utilities can cite it for their own system.
- Consider replacing some pipes and lining others, using predictive AI to set priorities.
Then quantify the status quo in dollars already documented:
- Customer service levels are disrupted by outages.
- Main break repair cost per event (typically $5K–$25K for distribution mains, $100K+ for transmission).
- Non-revenue water as a percentage and as treated-water-cost-equivalent (every gallon lost was sourced, treated, and distributed).
- Pavement restoration costs for the utility.
- Insurance claims, sinkhole repairs, and third-party damages.
- Boil-water notices incur administrative costs and reputational harm.
- These numbers exist in operating reports. Putting them in one slide reframes “capital spend” as “operating loss avoidance.”
Demonstrate analytical rigor with a defensible capital improvement plan
Councils and Boards are skeptical of “the sky is falling” arguments. They are persuaded by asset management discipline. Show:
- A risk-based prioritization model (likelihood × consequence) with clear tiers – critical mains serving hospitals, schools, and fire flow first; high-break-frequency segments next; coordinated replacements with planned road and sewer work to share trenching costs; materials with documented failure modes (unlined cast iron, asbestos cement, certain galvanized vintages).
- A formal asset management plan aligned with AWWA M77 or ISO 55000, a documented replacement rate target tied to average asset life, a rolling 10-year capital improvement plan with annual budget envelopes rather than spikes, and peer benchmarks against comparable utilities.
This converts the request from “trust us, it’s bad” into “here is the discipline we employ to spend these dollars prudently,” which is the actual standard boards apply.
Offer a clear path to fund your water infrastructure investment plan
Don’t show up asking only for a rate increase. Show financing options:
Loans through bonds are a common funding mechanism for large projects. Federal money is still flowing from the Infrastructure Investment and Jobs Act, and state revolving funds are available (usually with a lot of paperwork). WIFIA loans are possible for large projects, and state-led grants are offered.
When asking for rate increases, show the ratepayer’s impact in dollars per household per month, not percentages.
“Less than a monthly streaming subscription to avoid a boil-water notice” is better than “a 4.2% rate adjustment.”
Tailor the close: How to justify your pipe replacement budget to each audience
For councils, lead with constituent stories, neighborhood-level maps, and the political cost of the next big break happening on their watch, not a funding request.
For the public, lead with reliability, safety, and predictable billing – and make the comparison between “planned modest increases” and “unplanned emergency increases plus damages.”
The strongest single sentence: “We are not asking permission to spend more. We are asking permission to spend earlier, more cheaply, and more fairly than the alternative.”
How VODA.ai supports risk-based capital planning
Tools now exist to make this entire process faster to run and easier to defend. VODA.ai’s Pipe Risk Management solution ranks every main by risk – likelihood of failure and consequence of failure – using the utility’s own data. Their Capital Planning tool turns that ranking into ready-to-fund projects: ranked, budget-constrained, and scored by risk-reduction percentage and ROI. What used to take weeks with a spreadsheet now takes just hours and can be regenerated the moment a budget or risk picture changes, giving councils and rate payers the “why this scope, why this cost” answer this piece has been building toward.
 Subscribe to our blog so you don’t miss the next article in the series.